
Comprehensive Real-Time Advanced Analytics
Email campaigns don’t end when you hit the “Send” button, quite the opposite. Regular monitoring and analysis, over time, of results and of subscriber behavior, helps to perform optimizations, to find strengths and weaknesses and to make changes to your marketing content and processes.
ActiveTrail offers an advanced analytics reporting system (that is an inseparable part of our email marketing system), that provides complete data, in real time, allowing simple and precise tracking of each newsletter or email campaign released into cyberspace.
Our reports furnish data on multiple, different levels, and present this information, as well as analyses of the data, in detailed or summary executive reports. A few examples of the information provided in our reports:
- How many newsletters were sent
- Error percentages while sending campaigns
- Open rates
- Click and CTO rates
- Subscription removal (unsubscribe) rates
- Complaints, as a percentage
Whatever the angle, whomever the audience and whatever the purpose, ActiveTrail reporting and analytics engine will give you what you need.
Types of Reports
ActiveTrail provides both low-level, detailed reports on specific sub-sets’ of campaign data, such as which sections of a campaign were clicked on most (hotspots), and big-picture, summary reports that allow managers and executives to quickly glean the information they need. Below are a few of the reports that can be generated.
Email Campaign Report
ActiveTrail draws, in real-time, all of the data mentioned at the end of the prior section (number of newsletters, open rates…) into an organized, comprehensive executive report of a single campaign’s performance.
While you can generate this report at any time, our reporting system is automated and sends a detailed report regarding each of your campaigns, about two days after a campaign is sent out.
In addition to a report about each individual campaign, ActiveTrail also offers a summary report, weekly or monthly. All you need to do is to mark in the system when you would like to receive the report and the desired frequency.
Such regular reporting gives you the means to conduct ongoing, efficient analysis of subscriber behavior after campaign delivery, which will help you formulate more effective campaigns, producing positive results that will show up in your top and bottom lines.
Tracking an Individual User
Are you interested in the virtual behavior of an average user? You may analyze such a user’s behavior, on an individual basis, to check what actions they took in regards to a specific campaign that you sent to them. All you need to do is to enter a user’s email address and to observe how they behaved.
A/B Split Comparison Report
What is the best time to send a campaign? On a weekday, or maybe it’s the weekend? What subject line works best? Will recipients be more likely to open your email if you add the words “Special Offer” to the subject line?
Don’t play the guessing game!
We have created a sophisticated report, just for you, that will analyze the data from your A/B Split campaign.
The system collects data regarding each version of your campaign, A and B, and automatically selects the winning flavor, based on criteria that you define.
A detailed report is generated for each version:
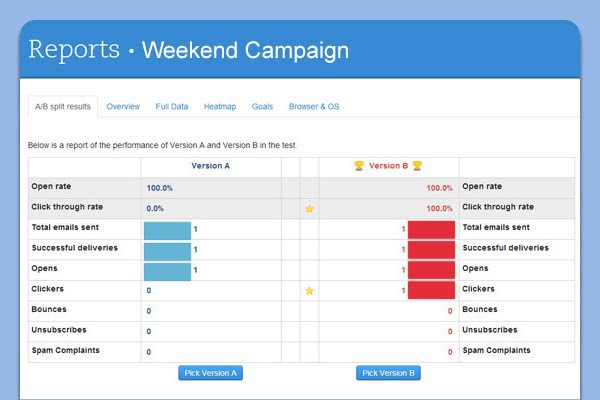
- Sent – How many recipients the campaign was sent to.
- Removals – How many recipients asked to have their email address removed from the mailing list.
- Errors – How many erroneous emails are in your recipient group.
- Not Opened – How many recipients did not open your mailing.
- Opened – How may recipients opened your mailing.
- CTO (Click to Open) – How many clicks were made relative to the number of opened emails.
- Complaints – How many SPAM complaints were issued in light of the campaign.
The best way to find out which campaign works best for you is to try it out, to analyze the comparative data and to try again.
Campaign Comparisons
Presenting data regarding your campaigns, side by side, is a good way to measure success or failure. In our campaign comparison report, you may select up to 5 campaigns which you would like to compare to each other, and the system will present all of the campaigns’ data relative to one another, in a single report.
Mobile vs. Desktop Report
When over 40% of your recipients are opening your campaigns on their mobile phones, it is acutely important to examine precise information that includes data regarding mobile devices.
The Mobile vs. Desktop report gives you an opportunity to view the total body of your campaign data, to help you understand your subscribers’ internet/device usage behavior.
The mobile report presents the data by browser (Gmail, Safari, Android, etc.) and by operating system (Android, iOS). In this fashion, you will be able to perform broad-based tests on all of the leading browsers, to ensure that campaigns are presented as they should be.
“Hotspot” Click Report
Using the Hotspot Click Report, you can understand where your subscribers are focusing their attention and what is catching their eyes.
The report is presented visually, layered over the campaign that you sent out, and it shows you the specific points that were clicked, how many clicks were made and their percentage of total clicks.
SPAM Complaint and Erroneous Removal Reports
Our reporting system allows us to track the percentage of subscribers that unsubscribed, whose email address is incorrect or who reported you as SPAM, for each of the campaigns you send out.
Keeping tabs on client reactions to your campaigns will help you minimize the number of removals or reports of SPAM. ActiveTrail automatically collects this data for you, for every campaign.
The tracking report displays information, separately for each campaign, allowing you to compare between your different campaigns and to better analyze your subscribers’ behavior.
Additional Reporting and Analytics Features
In addition to the various reports, ActiveTrail allows you to generate analyses, and offers additional capabilities that will help you gain even more insights.
Google Analytics Integration
Would you like to know how much traffic was generated by your campaign? How many new leads did it bring in? Whether your call-to-action (CTA) button really worked?
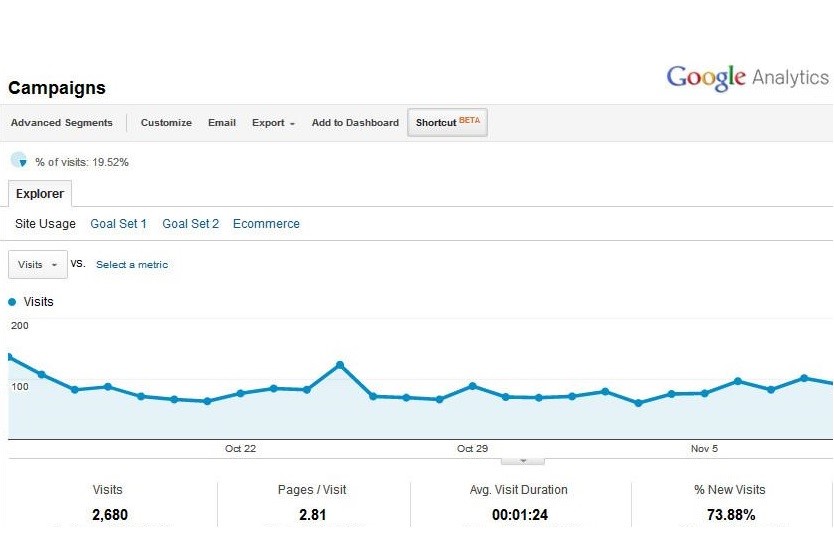
At ActiveTrail we make all this information accessible to you through the system’s integration with the most powerful and superior analytics engine in the world – Google Analytics.
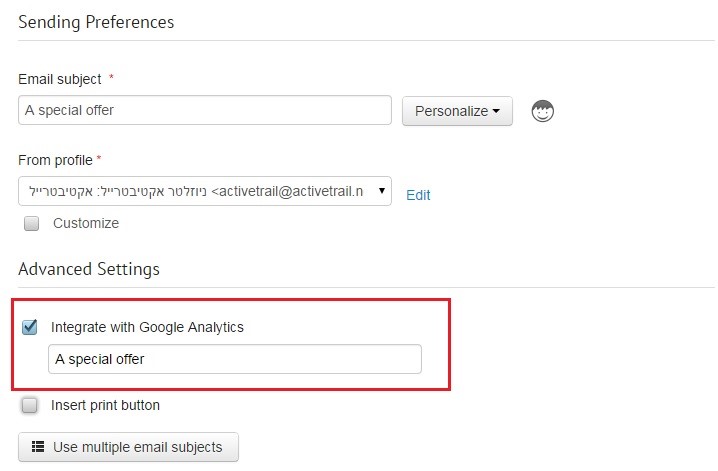
As soon as you mark the “Google Analytics” check box in the ActiveTrail system, your business’s account on Google Analytics will be automatically updated with the campaign’s data.
Together with ActiveTrail’s advanced reporting system, you will have a wide-angle view of all aspects of your campaign:
- Site visits
- Time spent on your site
- Conversion rate
- Abandon rate
- ROI
Tracking Goals
You can set precise targets for each step in your campaign: beginning with the call to action button that you added to your newsletter and ending with the shopping cart or even the thank you page presented after purchase is made.
For each such step, you can enter a URL and a name, allowing you to follow the activities of your site visitors.
The purpose of these reports is to shed light on the behavior of your subscribers, their reactions to your campaigns, and to the various step leading up to a purchase.
so…
While a single campaign may help with a specific task, most organizations have ongoing email marketing activities, and are continuously looking for ways, rooted in solid data and analyses, to improve their efforts. ActiveTrail’s reporting system gives you just that, by providing direct access to your campaign data and analytics so that you can gain insights regarding your subscribers and get the most out of your campaigns.